
Something quietly shifted at the checkout lane. The number that once made you wince – that monthly grocery total – has started to feel different. Not because prices have dropped, but because Americans have slowly, painfully recalibrated their expectations of what feeding a household actually costs. It’s a strange kind of financial acceptance, somewhere between adaptation and surrender.
Welcome to the new normal. Somewhere between the egg shortages of early 2025 and the USDA’s latest forecasts, a figure that would have been shocking just five years ago has become the everyday benchmark for millions of families. What does that number look like? And how did we all get here? Let’s dive in.
The Number That Now Defines a “Normal” Grocery Month

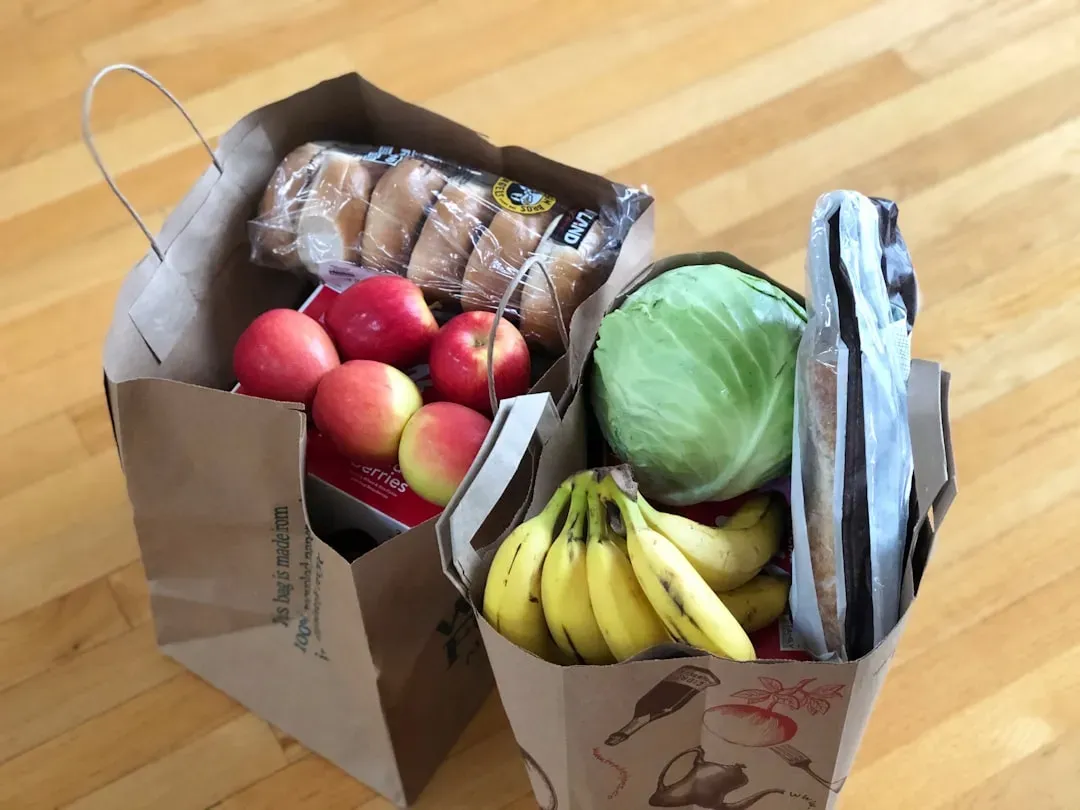
The average U.S. household spends about $504 per month on groceries, according to Bureau of Labor Statistics data. That figure is increasingly the one people hold in their heads as the baseline – a rough-and-ready answer to “is my grocery bill normal?” Honestly, the fact that half a grand per month feels ordinary is remarkable when you think about it.
In 2025, the average American spends about $370 per month on groceries per person, though the figure can vary widely based on factors like age, dietary preferences, and individual eating habits. So if you’re a couple, you’re looking at something closer to $740 just to keep the fridge reasonably stocked. That’s a figure that would have raised eyebrows not long ago.
Groceries continue to be a large part of household budgets, and a set budget never seems to be enough to cover the costs. A recent Popmenu survey found that Americans spend $235 per week on groceries, or $940 per month. For anyone trying to make sense of the gap between the BLS household average and per-person surveys, the difference comes down to methodology – but either way, the numbers paint a consistent picture of a nation spending more at the grocery store than ever before.
How USDA Benchmarks Frame What “Comfortable” Actually Looks Like
For 2026, the USDA moderate-cost plan suggests a single adult should aim for about $328 to $388 per month depending on age and gender, while a couple can expect to spend around $800 monthly. These numbers are not aspirational. They are the USDA’s version of a realistic, reasonably comfortable food budget, and they’ve crept steadily higher every year.
September 2025 data shows that the average family of four on the thrifty food plan spends $1,002.20 per month on groceries, which is more than $12,000 per year. That same family would spend $1,631.10 per month on the liberal monthly plan, which amounts to $19,573 per year. Read those numbers again slowly. Over $12,000 per year just on grocery store essentials, on the tightest USDA budget. That’s a second rent payment in some parts of the country.
On average, the cost of food for a single adult male with a moderate USDA food budget is $465 a month, while a single adult female is approximately $392. A realistic monthly grocery budget for two people, one adult male and one adult female, on a moderate food budget would be $785. These USDA figures are worth bookmarking. They give us the clearest picture of where the “comfortable” threshold actually sits today.
The Cumulative Shock: How We Got to This Point

Since February 2020, grocery prices have jumped 29% cumulatively. Let that sink in for a second. Nearly a third more for the same cart of groceries compared to pre-pandemic. That’s not a blip – it’s a fundamental restructuring of household finances that crept up on people one receipt at a time.
In 2022, food prices increased by 9.9 percent, faster than in any year since 1979. That year was the gut-punch. It’s when people first started doing uncomfortable math in the cereal aisle, comparing the cost of brand-name pasta to the generic option one shelf below. Food prices rose by 2.3 percent in 2024 and 2.9 percent in 2025, slower than they had increased during 2020 to 2023, with food-at-home prices increasing by 1.2 percent in 2024 and 2.3 percent in 2025, lower than their historical average pace of growth.
Food inflation in the US has held steady at about 3% annually for the past two decades, with one glaring deviation being the pandemic years, when food prices spiked upwards of 10% in 2022, which was also much higher than 2019 when it barely touched 2%. The pandemic years were the exception, but they reset everyone’s baseline permanently. There’s no going back to the old prices – the question now is just how fast the new ones keep climbing.
The Categories That Kept Making the Headlines: Eggs, Beef, and Beverages
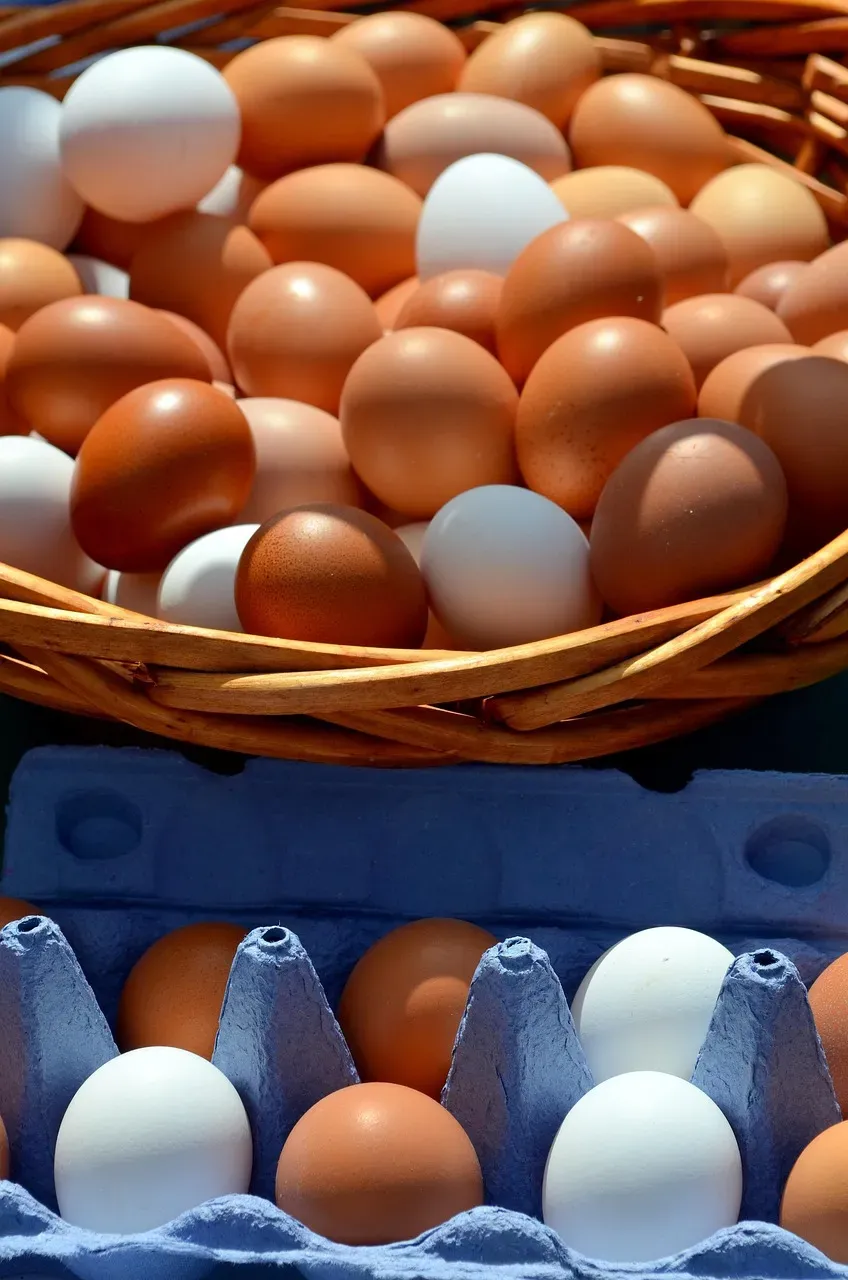
The spread of Highly Pathogenic Avian Influenza (HPAI) sent retail egg prices soaring in late 2024 and early 2025, turning eggs into the unlikely poster child of grocery inflation – the item that made rising costs feel personal. Prices peaked at $6.23 per dozen in March 2025, and over the full bird flu period from January 2022 to April 2025, the average retail price of a dozen Grade A large eggs jumped an astonishing 165.5 percent. Yes, that’s correct – not a typo.
Some relief has begun to show. Retail egg prices fell 5.3 percent from December 2025 to January 2026 and were 34.2 percent lower than in January 2025. After confirmed HPAI cases tapered in April 2025 and U.S. egg production rebounded, the U.S. Department of Agriculture expects prices to continue declining through 2026, potentially dropping another 27.4 percent. It’s welcome news – though the memory of $6 egg cartons still lingers.
Beef and veal prices also eased slightly, down 0.9 percent from December 2025 to January 2026, though they remained 15 percent higher than a year earlier, reflecting a smaller U.S. cattle herd since 2019. Looking ahead, grocery items most likely to rise in 2026 include sugar and sweets, which were already up 5.7 percent in January 2026 compared with January 2025, with the USDA projecting a further 6.7 percent increase over the year.
The Geography of Comfortable: Where You Live Changes Everything

People in Hawaii spend nearly 35% more on food than the average American. In addition to Hawaii, four other states face food costs that are at least 10% higher than the national average: Alaska, Rhode Island, Vermont, and Massachusetts. Here’s the thing: your zip code might be the single biggest factor in determining whether your grocery budget feels “comfortable” or crushing.
States like West Virginia, Arkansas, and Iowa tend to have the lowest average grocery bills, with households in these states spending as little as $770 to $850 per month, thanks to a lower cost of living, more accessible local food sources, and reduced shipping costs. That’s a gap of several hundred dollars per month between the cheapest and most expensive states – a difference that compounds painfully over the course of a year.
Even in lower-cost states, grocery spending can eat up a disproportionate amount of a family’s income, especially in states with lower median wages. Households in Mississippi, for example, spend nearly 2.64% of their annual income on groceries, the highest share in the country. So the “comfortable” budget figure isn’t really one number. It’s a moving target depending on where you shop, what you earn, and how you eat.
How Americans Are Mentally Adjusting and What 2026 Holds
A decline in consumer concern about rising costs suggests that shoppers may be becoming comfortable with the impact of inflation and grocery prices overall. In January 2026, 62% of consumers told FMI in a rolling survey that they feel very or extremely concerned about rising prices – which is high – but also 6 percentage points lower than a year ago. That six-point drop is significant. It means that for many Americans, the anxiety is slowly becoming acceptance.
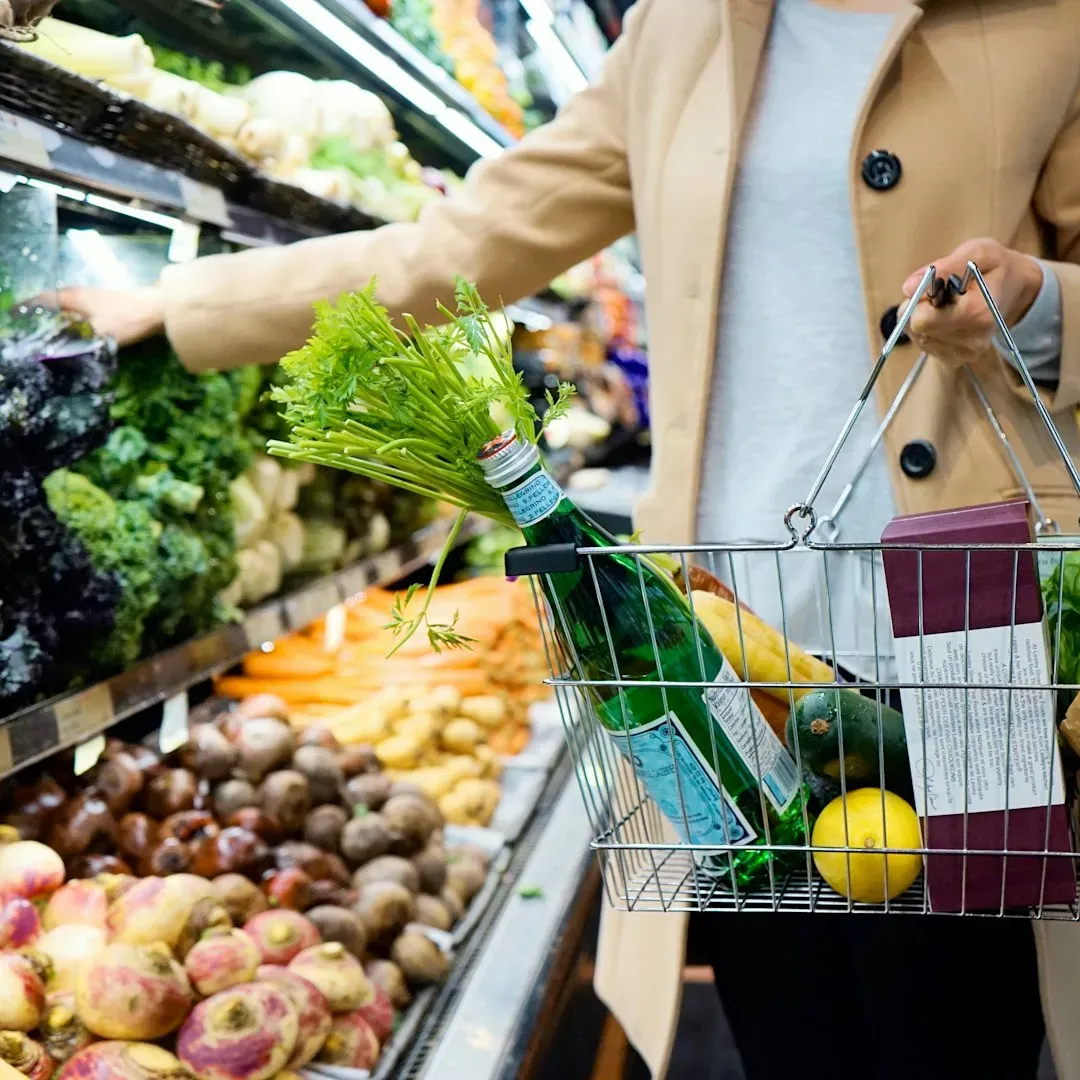
Companies say consumers are strapped and adjusting their shopping patterns. They’re buying smaller sizes, using coupons and skipping discretionary items, purchasing only the essentials. They’re also eating more meals at home. Honestly, this behavioral shift might be the most telling signal of all. When buying smaller packages feels like a financial strategy rather than an accident, something fundamental has changed in how Americans relate to food spending.
In 2026, overall food prices are predicted to rise 3.1 percent. Food-away-from-home prices are predicted to rise 3.7 percent, faster than their 20-year historical average rate of price increase. However, food-at-home prices are predicted to rise 2.5 percent, slower than their 20-year historical average rate of price increase. The takeaway from all of this? The pace of pain is slowing – but the prices themselves are not retreating. Analysis from USDA and FMI suggests that slowing inflation for groceries in 2026 may offer consumers a sense of stability in the coming years, even if they are unhappy currently with the year-over-year increases.
The “comfortable” grocery budget in 2026 isn’t the one you would have imagined five years ago. It’s higher, it’s harder to hit, and it means something different depending on your family size, your state, and your paycheck. The number itself – somewhere around $500 per household per month on average, or $370 per individual – carries the weight of years of inflation, supply chain crises, and a quiet recalibration of what normal even means anymore. What surprised you most about where that number landed? Tell us in the comments.